dgxtop v2:面向 Linux 与 DGX Spark 的 Nvidia GPU 终端监控工具
Dgxtop v2: A Terminal Monitor for Nvidia GPUs on Linux and DGX Spark
dgxtop v2 发布,这是一款用 Rust 编写的 Nvidia GPU 终端监控工具,为 DGX Spark 打造,也可运行在任意搭载 Nvidia GPU 的 Linux 机器上。
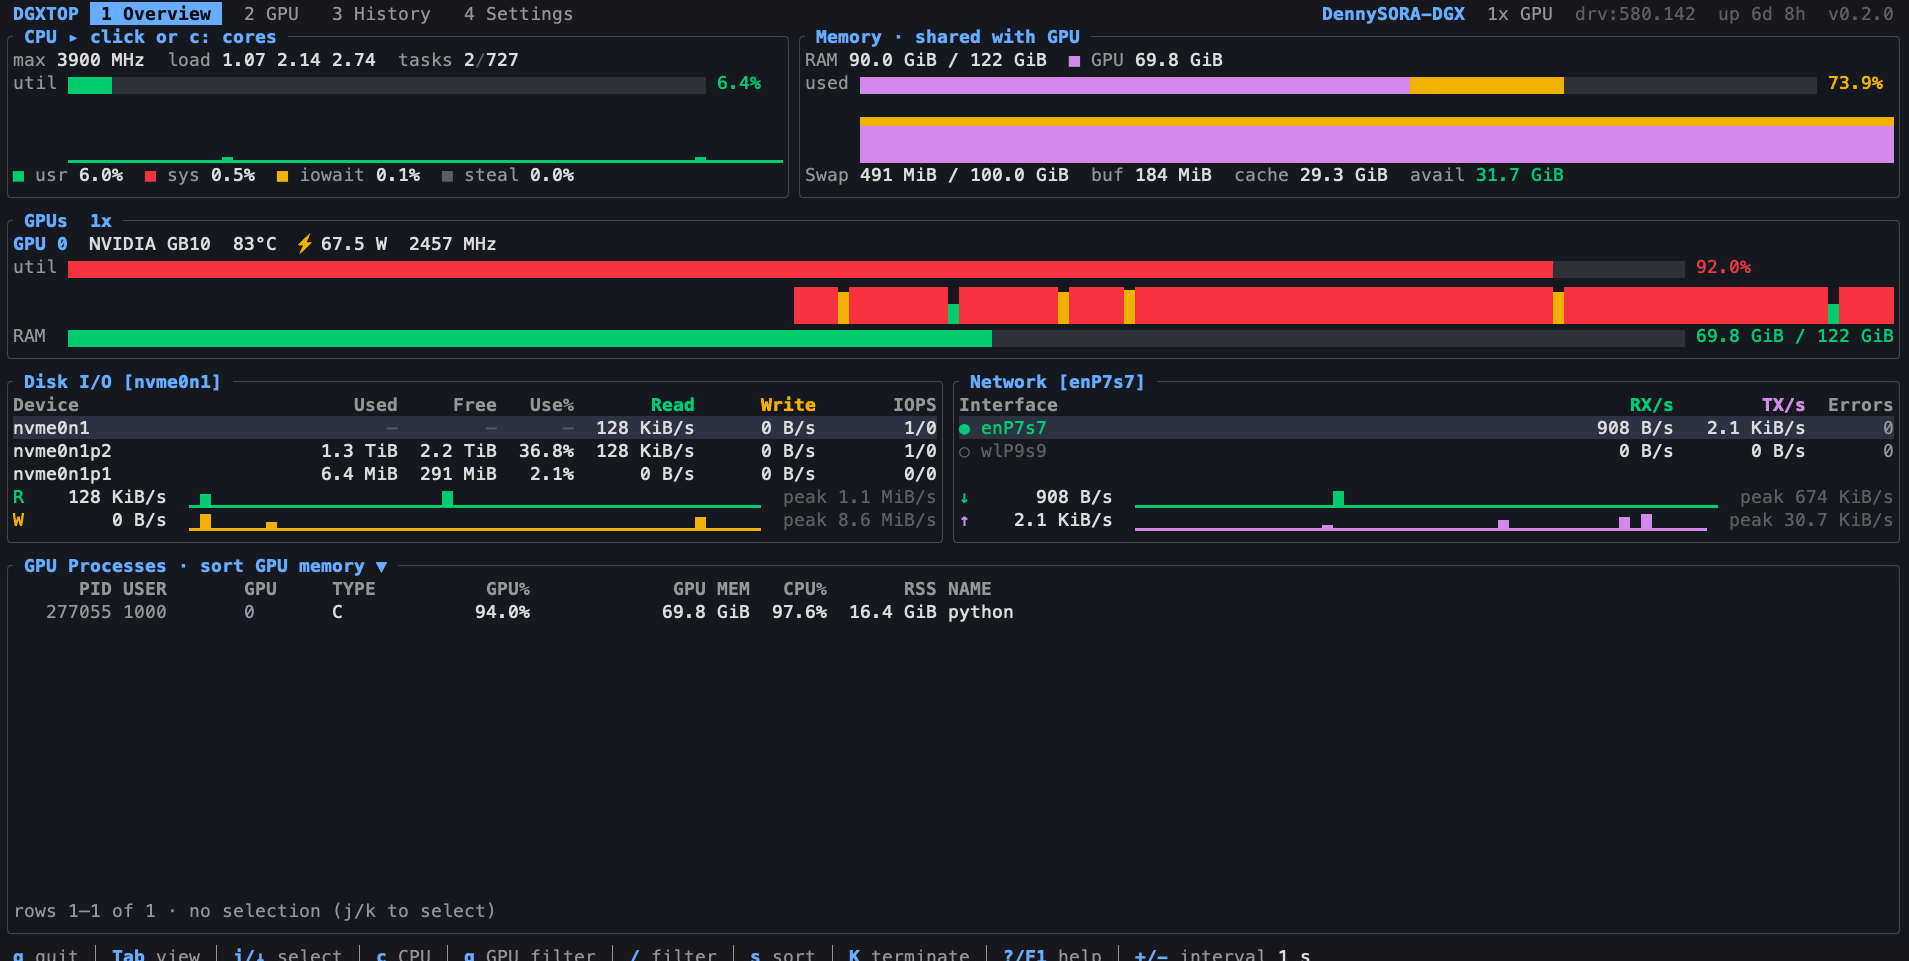
dgxtop 是 Linux 和 DGX Spark 上 NVIDIA GPU 的终端监控工具。一个屏幕显示每个 GPU 的利用率、内存、温度、功耗和时钟频率,哪个任务占用了多少内存(每个任务用不同颜色区分),以及机器的其他部分:CPU、内存、磁盘和网络。每个 GPU 任务从开始到结束都会被记录,包括其命令行、峰值内存和结束方式,历史记录保存在磁盘上,重启后依然存在。它专为 DGX Spark 打造,也能在任何装有 NVIDIA GPU 的 Linux 机器上运行。
dgx-spark-overview.webp1909×969
安装
bash
curl -fsSL https://github.com/DennySORA/dgxtop/raw/main/install.sh | bash适用于 x86_64 或 aarch64 架构、glibc 2.34 或更新版本(Ubuntu 22.04、Debian 12、RHEL 9 及更高版本)的 Linux,包括 DGX Spark。WSL 2 可运行 Linux 版本。GPU 指标需要 NVIDIA 驱动;没有驱动时,CPU、内存、磁盘和网络功能仍可使用。不支持 WSL 1、musl、macOS 和 Windows。
安装程序会为你的 CPU 选择对应的版本,用发布版的 SHA256SUMS 进行校验,然后安装到 ~/.local/bin。旧版本会保留,运行 ./install.sh --rollback 即可恢复。
源代码、完整用法和所有版本:github.com/DennySORA/dgxtop(外部网站)
功能
htop 以 CPU 为中心,nvtop 和 nvidia-smi 只在你观察时显示 GPU。dgxtop 把 GPU 放在首位,显示哪个任务占用了多少 GPU 内存,并记录每个 GPU 任务和整台机器的历史。
- 所有 GPU 一目了然。 每个 GPU 的利用率、内存、温度、功耗、时钟和风扇,配有实时图表。仪表在低于 50% 时保持绿色,接近红线(默认 80%)时从琥珀色变为红色。
- 按进程查看内存。 占用 GPU 内存最多的八个进程各有一种颜色,在内存条、图表和进程表中保持一致,让你看清哪个任务占用了多少。颜色由进程名决定,因此任务或 dgxtop 重启后颜色不变,除非列表中已有其他进程使用了该颜色。
- 按运行内容命名。
python -m vllm.entrypoints.openai.api_server显示为vllm.api_server,ComfyUI文件夹中的python main.py显示为ComfyUI/main,而不是python3。 - GPU 进程。 每个使用 GPU 的进程,显示其 GPU、类型(计算或图形)、GPU 使用率、GPU 内存、CPU 和 RAM。可按任意列排序,按 GPU 或名称筛选,确认后可用
K(SIGTERM)或F9(SIGKILL)终止进程。 - 进程历史。 每个 GPU 进程都会作为一次运行被记录,从开始到结束:运行时长、峰值 GPU 内存和 RAM、GPU 和 CPU 使用率,以及结束方式:带代码退出、被信号终止、从 dgxtop 停止、很可能是 OOM killer,或仍在运行。打开一次运行可查看其完整命令行、工作文件夹,以及 CPU、内存、GPU、线程、打开文件、磁盘和网络的图表。
- 概览历史。 CPU、内存、每个 GPU 的利用率、内存、温度和功耗、磁盘和网络,以本地时钟显示 1 分钟到 24 小时的条形图,每个图表都有当前值、平均值和最大值,以及每个 GPU 的平均值、峰值和能耗。
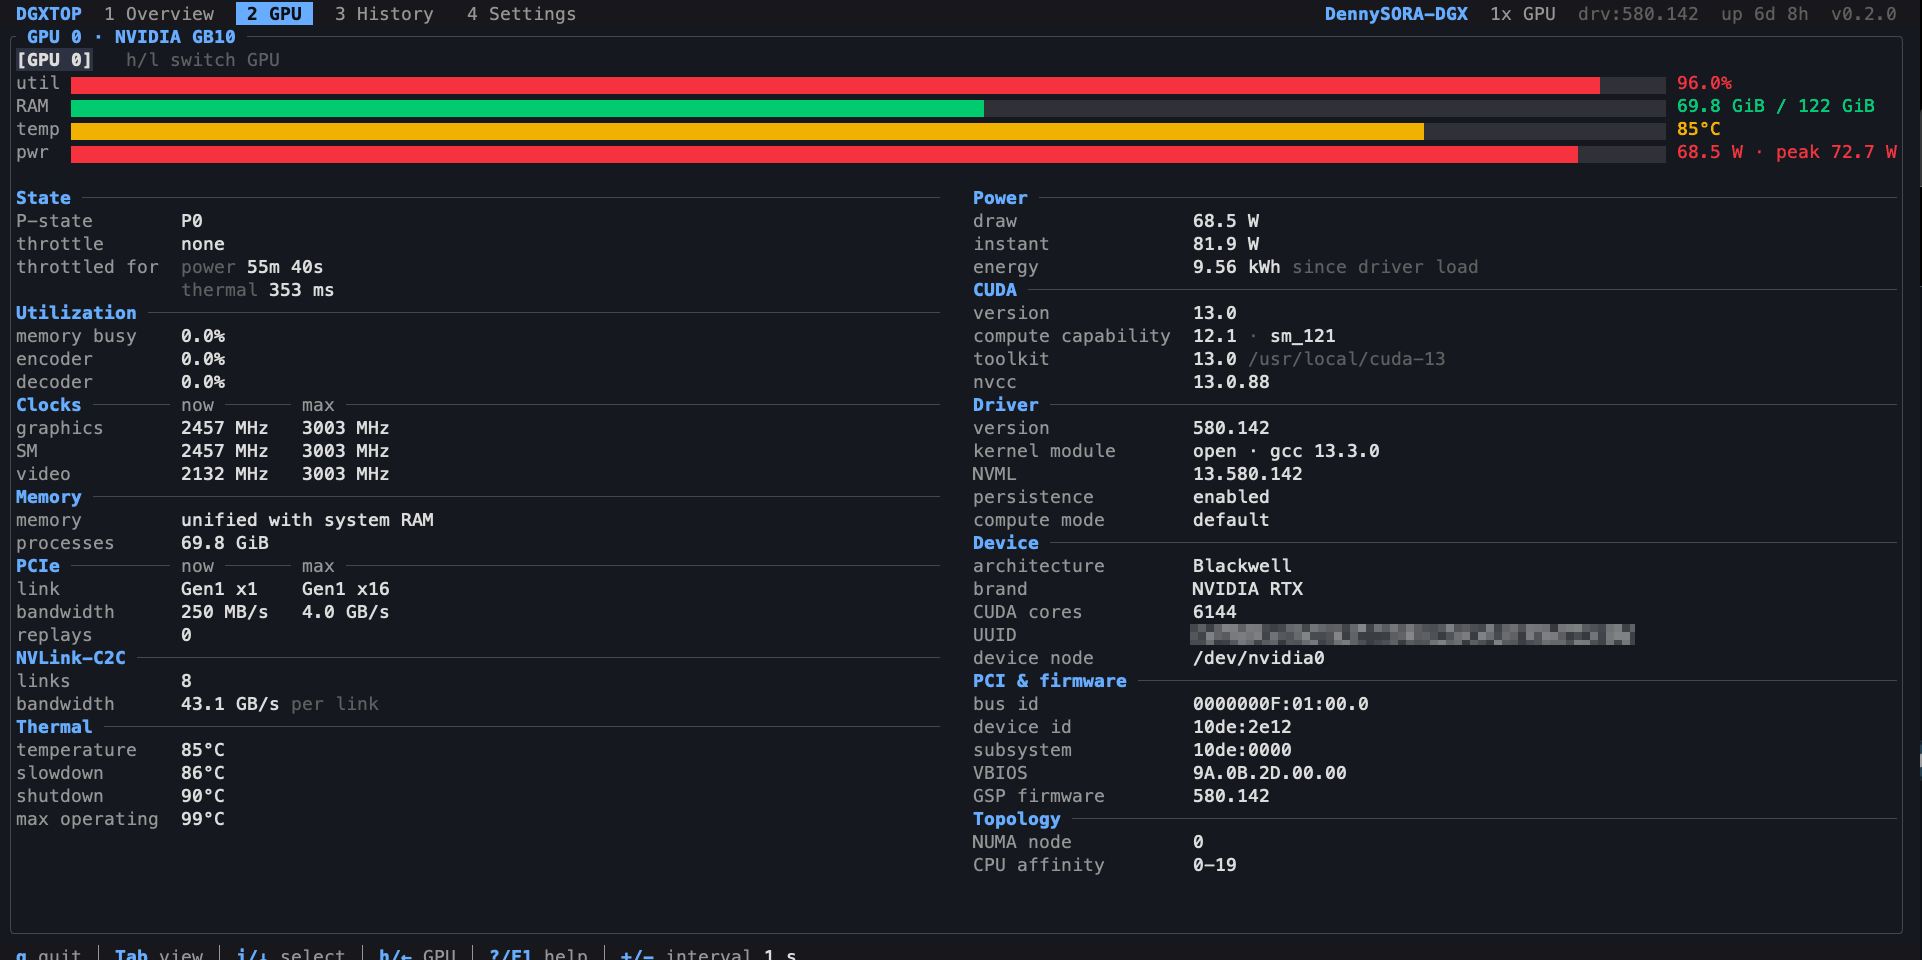
- Full GPU details. One GPU at a time, with everything the driver reports; a value the GPU does not report gets no row:
- 性能状态、降频原因和降频时长、时钟频率
- 内存和内存总线、PCIe 链路和流量、NVLink-C2C
- 温度限制、风扇、功耗限制和能耗
- CUDA、驱动、NVML 和 Linux 内核版本
- 设备、PCI 和固件、NUMA 和 CPU 亲和性、P2P 路径
- 整台机器。 每个核心的 CPU 使用率、CPU 温度以及每种核心的当前频率和最大频率;内存、交换分区、缓冲区和缓存;磁盘的可用空间、IOPS、延迟和驱动器温度;网络吞吐量、错误和丢包。
- 为 DGX Spark 打造。 在 GB10 的统一内存上,内存条会拆分为系统占用和每个 GPU 任务占用。dgxtop 还会读取 GB10 的 CPU 集群温度及其 NVLink-C2C 链路,并提供原生 aarch64 构建。
- 应用内设置。 更改采样间隔和显示模块,并查看每个数据源的状态。每项设置都会显示其保存值和生效值、来源,以及是立即生效还是重启后生效。
屏幕截图
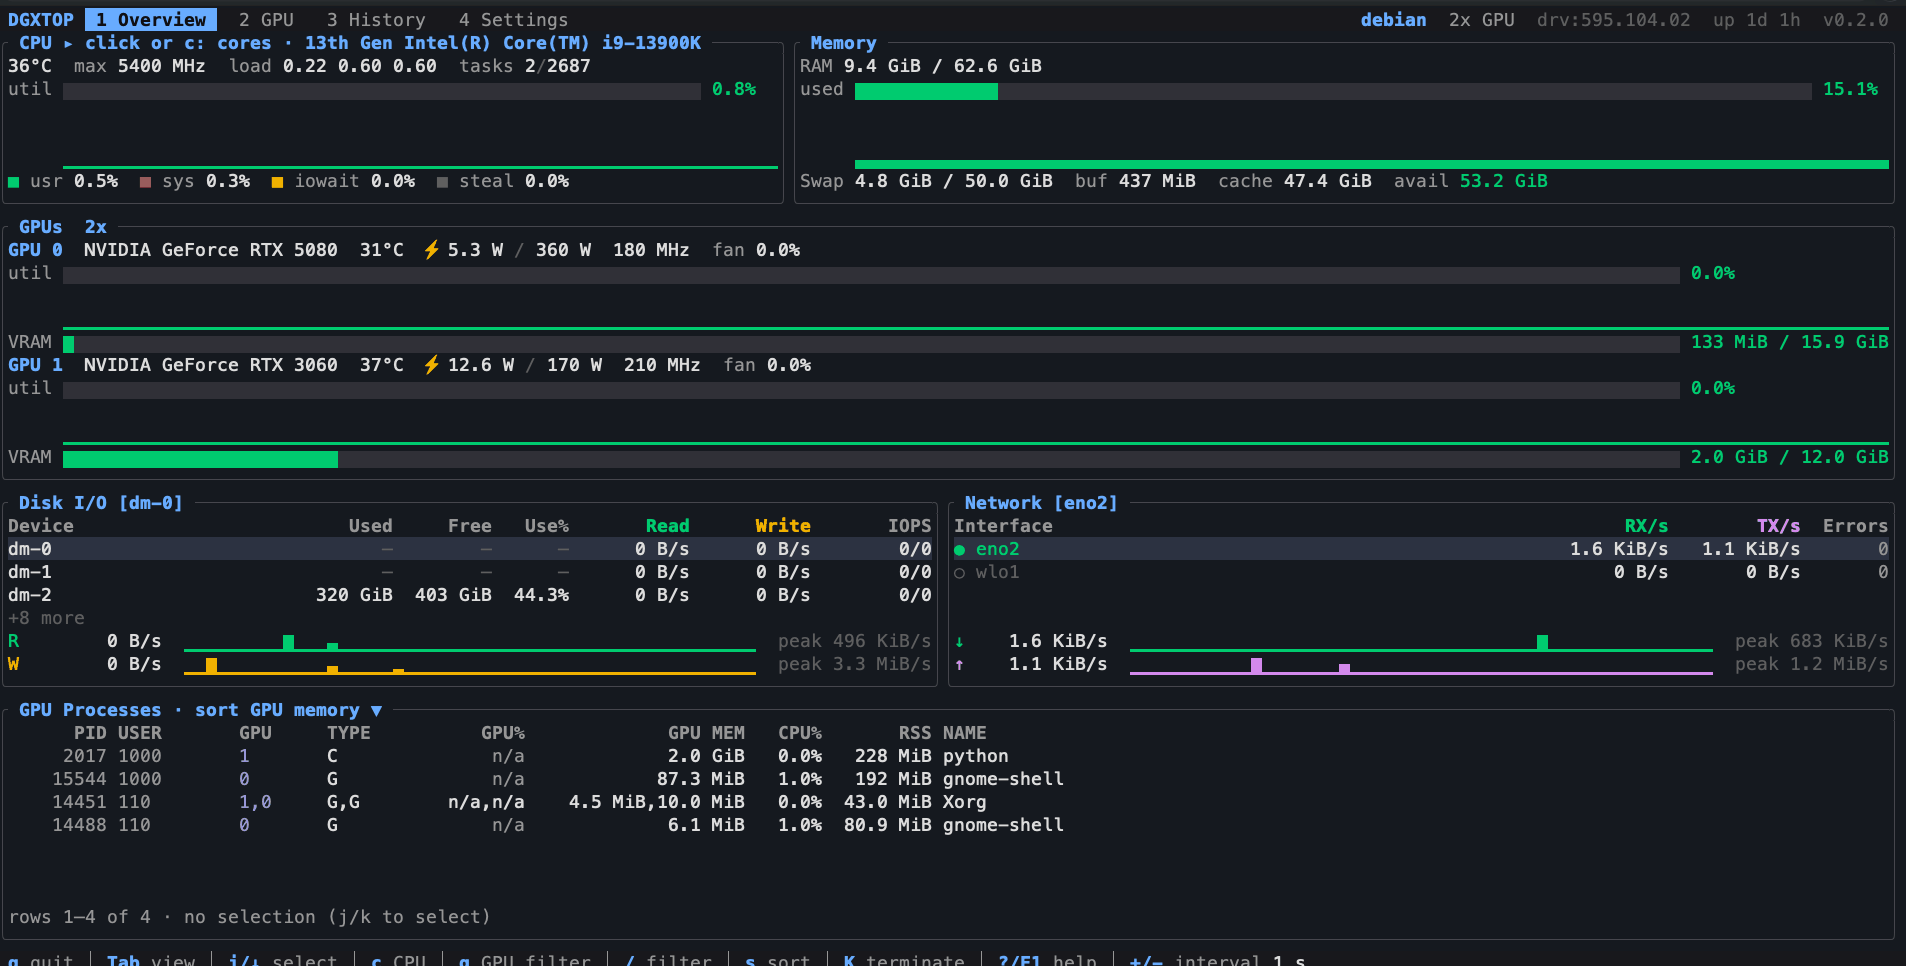
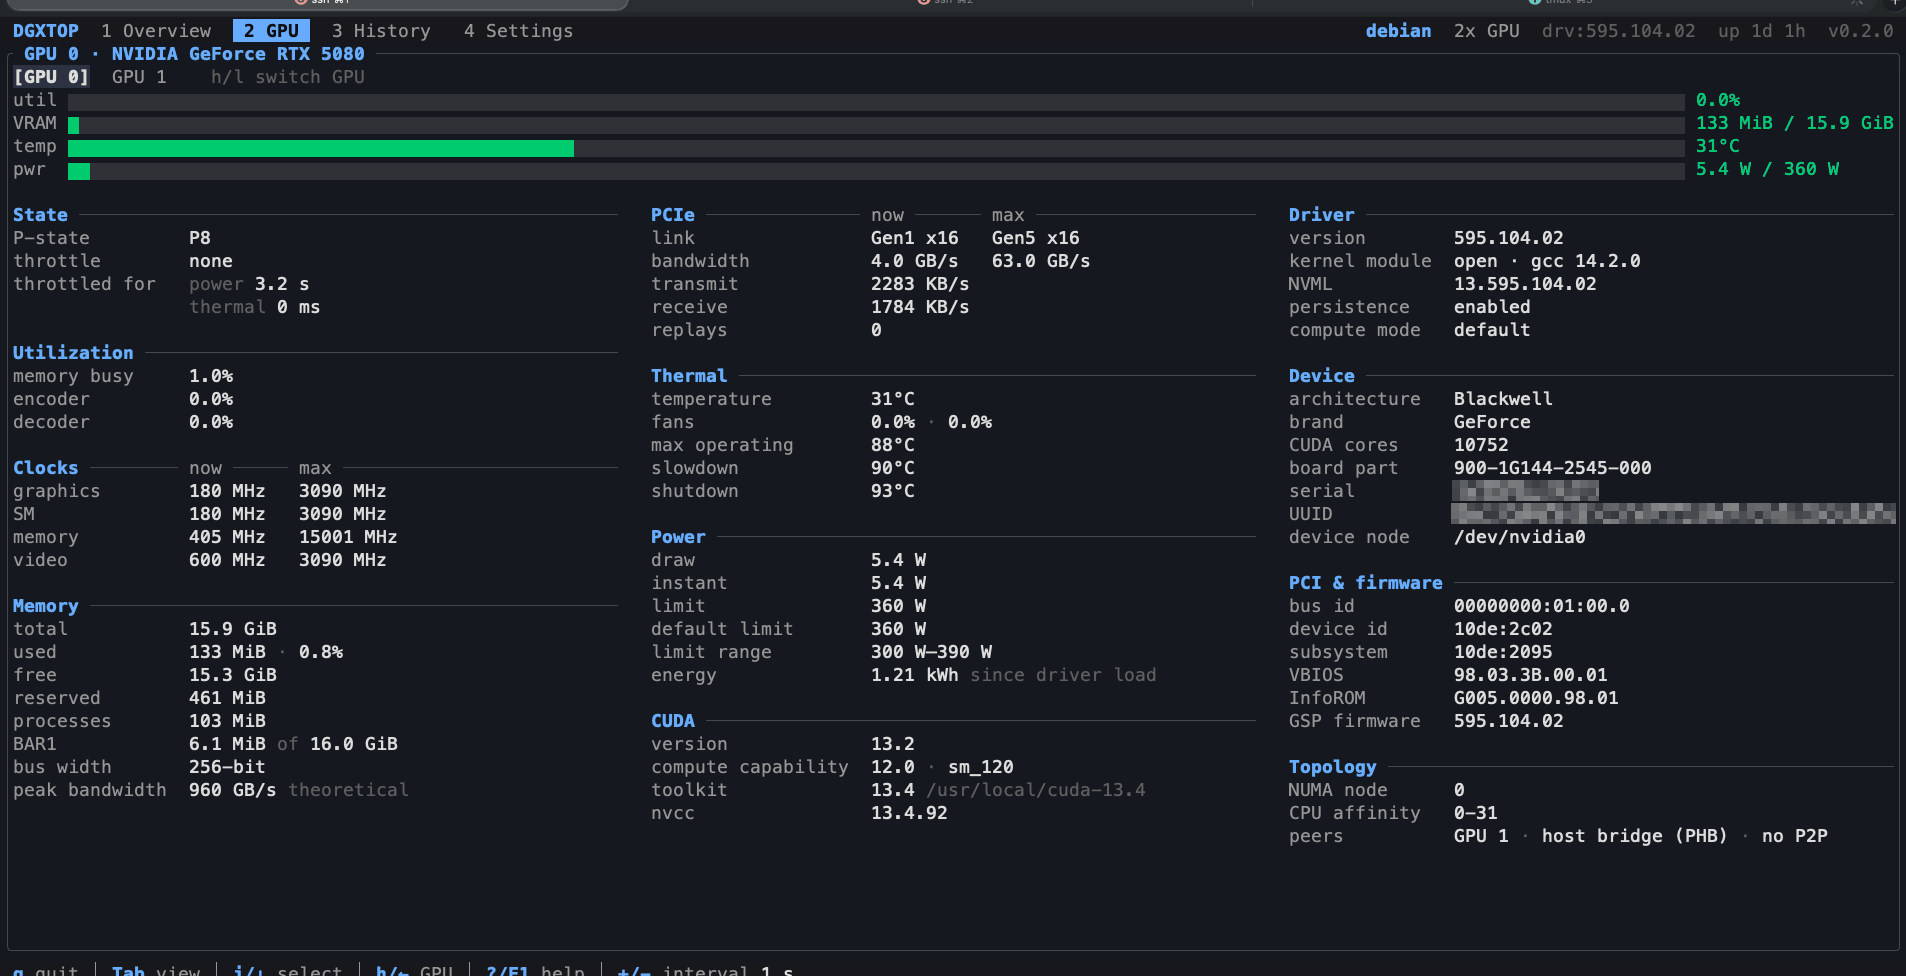
在测试 dgxtop 的两台机器上的概览、GPU 视图、概览历史和进程历史(含一个已展开的运行记录)。
workstation-overview.webp1918×967
dgx-spark-gpu.webp1913×962
workstation-gpu.webp1914×963
workstation-overview-history.webp1913×957

workstation-process-history.webp1910×952

workstation-process-run.webp1919×959

功能
- 每台机器多块 GPU。 已在 DGX Spark(GB10)以及配备 RTX 5080 和 RTX 3060 的工作站上测试。
- 持久的历史记录。 历史记录保存在磁盘上,重启和重新启动后依然保留,且无时间限制:每种柱状大小保留其最新 300 个柱,因此 1 分钟柱覆盖最近 5 小时,24 小时柱约覆盖 10 个月。进程历史列出最新 512 次运行记录。dgxtop 在运行时记录。
- 轻量。 用 Rust 编写。默认每秒绘制 4 次新数据,数据占用固定在 256 MiB 以内。
- 任意终端尺寸。 宽屏、单列和紧凑布局,最小支持 40×10。支持键盘和鼠标,以及四种配色主题。
- 私密。 无网络访问,无遥测。设置和历史记录是只有你能读取的文件。进程历史保留 GPU 进程的命令行、工作文件夹和程序;环境变量从不存储。
- 安全的进程操作。 仅限你自己的进程,绝不来自 root 会话,且仅在确认过期后执行。信号通过 pidfd 发送,因此绝不会误伤被复用的 PID,并且每个操作都会记录日志。
--read-only可将其关闭。 - 安全升级。 安装程序会校验每次下载,并保留上一版本,以便一条命令回滚。
架构
dgxtop 是一个程序。适配器在各自的后台进程中读取硬件,读数沿数据路径向下流动,Manager 将它们转化为屏幕绘制的视图。每个快照也会写入历史,你的按键和命令则沿控制路径传递。
architecture-en.webpGPT 生成 · 1536 × 1024

数据路径
Linux + NVIDIA 驱动/proc · sysfs · NVML
适配器每个一个后台进程
- procfs
- hwmon
- thermal
- powercap
- NVML
- network
- filesystem
采集器单位 · 来源 · 速率
状态实时快照 · 短期趋势
Manager读取状态和历史 · 视图
查看器屏幕 · Ratatui
历史路径
状态每个已提交的快照
历史概览历史 · 进程历史
压缩1 分钟到 24 小时的柱
存储SQLite · 文件
控制路径
查看器按键 · 鼠标 · 命令行
Manager检查每条命令
设置 · 采样 · 进程操作pidfd · 已确认 · 已记录
查看器显示结果
| 组件 | 功能 |
|---|---|
| 适配器 | 读取硬件:/proc、hwmon、thermal zones、powercap、用于 GPU 的 NVML、网络和文件系统,每个都在自己的后台进程中。每个 GPU 进程后跟一个只读探测。 |
| 采集器 | 将原始读数转化为指标:单位、每个值的最佳来源、来自计数器的速率、每个进程一条记录。 |
| 状态 | 保存实时快照和短期趋势,仅在内存中。 |
| 历史 | 保存概览历史和进程历史,并决定保留什么、丢弃什么。 |
| 压缩 | 将样本合并为 1 分钟到 24 小时的柱,与本地时钟对齐。 |
| 存储 | 仅在收到请求时读写 SQLite 数据库和文件。 |
| Manager | 调度采样、应用设置、检查命令和进程操作,并构建视图。它本身不保存数据。 |
| 查看器 | 根据 Manager 的视图用 Ratatui 绘制屏幕,并将按键和鼠标点击转化为命令。 |
| 运行时 | 监督适配器进程、它们的 IPC 和有界队列、日志和终端。 |
以下各节跟随一个样本走完这一设计,然后依次介绍每个部分,均按 v2.1 中的实现。
一个样本,端到端
每一秒,读数都从内核到你的终端走同样的八步,没有任何一步会等待屏幕或慢速适配器。
one-sample-en.webpGPT 生成 · 1536 × 1024

- 调度。 Manager 让每组读取按各自的时钟运行:主组每秒一次,容量和慢速健康读数每 5 秒一次,设备发现每 10 秒一次,不支持来源的复查每分钟一次。错过的时隙绝不重放,而当下一个时隙到来时仍在运行的组会被计为跳过,而不是排在自己后面。
- 请求。每个读取计划都带有一个提前 500 ms 的截止时间和适配器的代次。监督者将其写入该适配器的管道,适配器以页为单位应答,因此任何请求都不会涉及超过 256 个来源。
- 读取。适配器返回一个值或一个状态:不支持、权限被拒绝、超时、错误或已移除。失败的读取永远不会变成 0。
- 收集。两个收集器工作线程会规范化单位、将计数器转换为速率、为每个指标选择一个来源,并将每个进程合并为一条记录。
- 单一写入者。状态 actor 是唯一的写入者。它在更改任何内容之前会完整检查一次提交(epoch、基础修订、值、单位和内存),将其传递给历史记录,然后才发布一个新的不可变快照。读取者从不持有可变句柄,屏幕上的值已经存在于历史记录中。
- 绘制。Manager 根据最新快照和历史记录构建视图。查看器默认每秒绘制新数据 4 次(可配置为 1 到 20 次),当 dgxtop 处于压力下时每秒 2 次,并在按键或调整大小后立即重绘,每秒最多 20 次。
- 迟到的回复。超过其截止时间或来自较旧适配器代次的回复会被丢弃,早于三个采样周期的值会被标记为过期。
适配器进程
对驱动的调用可能会阻塞,而被阻塞的调用会冻结发起它的线程。因此 dgxtop 既不在屏幕线程上也不在其自身进程中进行这些调用。
isolation-en.webpGPT-generated · 1536 × 1024

- 七个子进程。procfs、hwmon、thermal、powercap、nvml、network 和 filesystem 各自运行在一个子进程中:同一个二进制文件,以
dgxtop --adapter-host <name>启动,最多 8 个。 - 分帧管道。每个子进程通过自己的管道与监督者通信,帧格式为 4 字节长度加 JSON:传输中最多 1 MiB,解码后最多 4 MiB,嵌套最多 32 层,每批 256 条记录。握手 nonce 和代次编号确保来自较旧子进程的回复绝不会被当作新回复。
- 退避。连续 3 次失败后,监督者会等待 1、2、4 秒,最多 60 秒,带有 ±10% 的抖动,然后才再次启动该子进程。
- 干净停止。子进程会分步停止:发送关闭请求并给予 200 ms 宽限期,然后 SIGTERM 并再等 200 ms,接着 SIGKILL 并最多用 1 秒回收它。无法回收的子进程会被隔离,并且永远不会再次启动,因此卡住的进程永远不会堆积。
- 线程,而非异步。主进程不运行异步运行时。终端运行在主线程上,旁边还有用于 manager、supervisor、日志和信号的命名线程、两个收集器工作线程,以及用于 state、history、审计日志、进程操作和进程探测的小型 actor。它们通过有界的 crossbeam 通道通信;任何地方的队列都不是无界的。
- 视图中。Settings 会列出每个适配器进程及其状态、上次成功时间和退避情况。
选择来源
一个量通常有多个来源:CPU 温度可以来自 hwmon,也可以来自 thermal zone。dgxtop 为每个指标显示一个值,从不对来源取平均。
source-arbitration-en.webpGPT-generated · 1536 × 1024

- 一个键。指标键命名主机、启动、实体、指标及其作用域。只有键相同的读数才会相互竞争,因此 SoC 温度永远不会与 CPU 封装温度竞争。
- 每个值上的四个标签。每个值都带有其读取状态、种类(实测、推导或估算)、质量等级(已验证、可用、可疑、未知或无效)以及新鲜度。只有已验证和可用的值才能代表该指标。
- 固定顺序。单位会被归一化并检查。经确认是通过两个接口看到的同一个传感器只计一次;仅凭数值相等永远不能证明这一点。其余按质量等级、来源优先级、最新读取时间、来源 ID 排序。最多比较 4 个候选值,且结果绝不取决于读数到达的顺序。
- 冲突而非平均。当两个不同的传感器偏差超过容差(温度容差为 8 °C)时,dgxtop 会标记为冲突,而不是取平均值。
- 不抖动。更好的来源只有在连续 3 轮、至少 5 秒内胜出后才会接管。
- 可复现。仲裁不进行 I/O、不保存状态,并记录每个值胜出的原因,因此相同的读数总是给出相同的答案。
分层历史
概览历史以固定空间保存数月数据:每个序列以十二种柱大小存储,每种大小保留其最新的 300 根柱。
history-tiers-en.webpGPT 生成 · 1536 × 1024

- 桶。每个样本落入一个 5 秒的桶中,最新的 120 个桶覆盖最近 10 分钟。一个桶存储其起始时间、覆盖的时间、值 × 时间之和、最小值、最大值以及它合并的样本数。
- 十二种柱大小。桶合并为 1、5、10 和 30 分钟以及 1、2、4、6、8、12、18 和 24 小时的柱。每种 300 根柱时,1 分钟柱可回溯 5 小时,24 小时柱约 300 天。
- 时间加权均值。一根柱的均值是其值 × 时间之和除以它覆盖的时间,因此有缺口的柱不会被稀释,没有数据的时间保持为缺口,而不会变成 0。
- 本地时钟。柱遵循本地时钟:小时从你所在时区的整点开始,24 小时柱从本地午夜到午夜。
- 磁盘上。柱存放在 history_tiers.sqlite3 中,约 40 MiB,分钟行也会写入 history.sqlite3 保存 7 天,最多 1 GiB。两者在重启后都会保留;dgxtop 在运行时记录。
进程历史如何工作
进程历史跟踪每个 GPU 进程,从 NVML 首次列出它直到它结束,无需 root,也无需扫描 /proc。
process-history-en.webpGPT 生成 · 1536 × 1024

- 身份。一个运行记录是 PID 加上进程的启动时间及其所在的启动,因此被复用的 PID 永远不会延续另一个进程的运行记录。
- 只读探测。每次最多读取 64 个进程的
/proc/<pid>/stat、io和status,每 10 秒统计一次打开的文件数,并读取命令行、工作目录、程序和 cgroup 各一次,每次最多 4096 字节。 - 一次运行记录的内容。CPU、常驻内存、GPU 使用率、GPU 内存、磁盘读写以及主机的网络,以 5 秒为桶,并使用与 Overview History 相同的十二种柱状尺寸。
- 它是如何结束的。dgxtop 根据普通用户可见的信息推断结束原因:如果它在最近 60 秒内发送过信号,则是它自己的信号;当内核的 oom_kill 计数上升且进程死于 SIGKILL 或未留下状态时,则是 OOM killer;否则是进程处于僵尸状态时读到的退出码或信号。dgxtop 停止时仍处于打开状态的运行会被标记为在 dgxtop 关闭期间结束。
- 保留的内容。最近的桶每 30 秒保存到 process_recent.json,运行记录保存到 process_history.sqlite3,大小约 40 MiB 以内。列表显示最近 512 次运行,最早结束的运行先被移除。
按进程统计的 GPU 内存
dgxtop 为占用 GPU 内存最多的每个进程分配一种颜色并保持稳定,因此一个作业可以在内存条、图表和进程表中被持续追踪。
gpu-memory-en.webpGPT 生成 · 1536 × 1024

- 说明运行内容的名称。进程以其运行的内容命名:
python -m的模块(vllm.entrypoints.openai.api_server→vllm.api_server)、脚本(train_supervisor.py→train_supervisor)、当内核 15 字节的comm截断时的完整程序名,以及通用名称对应的文件夹(ComfyUI中的main.py→ComfyUI/main)。只保留该名称,并清除控制字符。 - 稳定的颜色。颜色是名称在八种颜色上的 FNV-1a 哈希,因此作业或其 dgxtop 重启后仍保持其颜色。当该颜色已被占用时,使用下一个空闲颜色。
- 无闪烁。当八种颜色全部被占用时,新来者只有在占用内存达到最小者的两倍加 256 MiB 时才会取代它。dgxtop 跟踪 16 个进程,是颜色数量的两倍,因此刚退出的作业会在一段时间内保留其颜色。
- 统一内存。在 DGX Spark 上,GPU 共享系统内存,因此 RAM 条会拆分为系统占用部分和每个 GPU 进程的占用部分,并以各自的颜色显示。
安全的进程操作
从 dgxtop 停止 GPU 作业需要两步,并且只发送一个信号,每次尝试都有记录。
safe-actions-en.webpGPT 生成 · 1536 × 1024

- 谁的进程。仅限你自己的进程,绝不是 PID 1 或 dgxtop 自身,也绝不来自 root 会话。默认允许 SIGKILL,可以关闭;
--read-only会关闭所有操作。 - 两步。
K(SIGTERM)或F9(SIGKILL)会先询问。确认信息会指明那一个进程,10 秒后过期,最多可同时等待 8 个。 - 用 pidfd,而不是 PID。dgxtop 打开一个 pidfd,再次检查启动时间、用户和命名空间,并通过
pidfd_send_signal发送信号,因此在此期间被复用的 PID 绝不会被误伤。 - 意图先行。意图会在信号发出前写入 audit.sqlite3(WAL,synchronous=FULL),结果在信号发出后写入;如果意图无法在 1 秒内写入,则不会发送任何内容。如果 dgxtop 在两者之间停止,结果将保持未知,且该信号绝不会再次发送。
- 信号之后。dgxtop 每 250 毫秒观察一次进程,持续 10 秒,Process History 中的运行记录会显示它是从 dgxtop 停止的。
限制与过载
dgxtop 旨在与它所监视的任务一起运行数月,因此其中没有任何东西会无限制增长。
budgets-en.webpGPT 生成 · 1536 × 1024

- 单一内存预算。其数据存放在固定的 256 MiB 中,预先划分:原始历史 144 MiB、聚合 32、目录 24、预留 20、实时状态 16、视图 12、传入读数 8。内存在使用前即被预留。
- 每个队列都有上限。命令队列满(128)时返回 busy 而不是继续增长,传输中的读数上限为 32 批和 8 MiB。dgxtop 最多跟踪 512 个序列、2048 个来源(每个指标 4 个候选)、256 个进程和 1024 个 GPU 进程链接,并允许 2 个视图会话。
- 承压。当某个队列持续 75% 满,或一轮工作耗时超过采样周期,且持续至少 3 秒时,dgxtop 处于承压状态,每秒最多绘制 2 帧。
- 限流。当内存达到预算的 90% 或传入读数持续满载时,dgxtop 被限流:它对主组采样 2 次,然后 4 次,频率降低。
- 公开地恢复。一旦队列低于 50% 且内存低于 75%,dgxtop 每次回退一个级别,最多每 30 秒一次。当有效间隔与你设置的间隔不同时,页脚会显示该有效间隔。
磁盘上的文件
dgxtop 只写入你的 XDG 配置和状态目录下,权限设置只允许你读取。
storage-en.webpGPT 生成 · 1536 × 1024

- 默认私密。目录以 0700 创建,文件以 0600 创建,经过符号链接的路径会被拒绝。每个状态目录只运行一个 dgxtop,由 instance.lock 守护。
- 原子设置。config.json 写入一个新的临时文件(0600,独占创建),同步,重命名覆盖旧文件,并同步目录,因此崩溃绝不会留下半个文件。
- 格式,而非迁移。每个数据库在 SQLite application_id 中记录其格式。其他格式的数据库,例如来自 v2.0 的,会被重新创建为空而不是迁移。
- 在关键之处持久。audit.sqlite3 每次写入都同步(synchronous=FULL)。历史数据库使用 WAL 和 synchronous=NORMAL:断电可能丢失最后时刻的历史,但同步频率低得多。
- 私密数据。无网络访问,无遥测。Process History 保留 GPU 进程的命令行、工作文件夹和程序;从不读取环境变量。
| 文件 | 保存内容 | 限制 |
|---|---|---|
| config.json | 设置 | — |
| history_tiers.sqlite3 | Overview History 柱状图,1 分钟到 24 小时 | 约 40 MiB |
| history.sqlite3 | 分钟行 | 默认 7 天和 1 GiB |
| process_history.sqlite3 | Process History 运行及其柱状图 | 约 40 MiB |
| process_recent.json | GPU 进程最近 5 秒桶,每 30 秒保存一次 | 仅最近桶 |
| audit.sqlite3 | 进程操作,结果之前的意图 | 30 天,128 MiB |
| dgxtop.log | 日志 | 10 MiB 轮转,3 个文件 |
| instance.lock | 每个状态目录一个 dgxtop | — |
代码结构
代码是一个 Rust 工作区,由围绕一个共享契约 crate 的十一个 crate 组成。
crates-en.webpGPT 生成 · 1536 × 1024

- 唯一一条依赖规则。 每个 crate 只依赖 dgxtop-core,后者持有共享类型、视图和端口,且不做任何 I/O。唯一的例外是 history 使用纯压缩 crate,并且只有 dgxtop crate 将其他 crate 连接在一起。
- 在 CI 中检查。
scripts/check_boundaries.py在 CI 中检查该规则,与cargo fmt、clippy一起将警告视为错误,并在 x86_64 和 aarch64 上运行测试。 - 由 CI 发布。 发布版本在 Ubuntu 22.04 上为 x86_64 和 aarch64 构建,并附带 SHA256SUMS 发布。随后安装程序会在两种架构的 Ubuntu 22.04 和 24.04、Debian 12 和 Rocky 9 上安装它,并且必须拒绝 Alpine 的 musl。
| Crate | 包含内容 |
|---|---|
| dgxtop | 程序:命令行、模式、启动和连接 |
| dgxtop-core | 共享类型:指标、命令、视图以及组件之间的接口 |
| dgxtop-runtime | 后台进程、IPC、队列、日志、终端和时区 |
| dgxtop-adapters | procfs、hwmon、thermal、powercap、NVML、网络、文件系统、进程探测和进程操作 |
| dgxtop-collectors | 来自读数的指标:速率、来源选择和进程记录 |
| dgxtop-state | 实时快照和短期趋势 |
| dgxtop-history | 概览历史、进程历史以及各自保留的内容 |
| dgxtop-compression | 从 1 分钟到 24 小时的柱状图 |
| dgxtop-store | SQLite 数据库和文件 |
| dgxtop-manager | 调度、设置、会话、进程操作和视图 |
| dgxtop-ui | 屏幕、小组件和按键映射 |
来源:Hacker News · dennysora.me