dgxtop v2:面向 Linux 与 DGX Spark 的 Nvidia GPU 终端监控工具
Dgxtop v2: A Terminal Monitor for Nvidia GPUs on Linux and DGX Spark
dgxtop v2 发布,这是一款用 Rust 编写的 Nvidia GPU 终端监控工具,为 DGX Spark 打造,也可运行在任意搭载 Nvidia GPU 的 Linux 机器上。
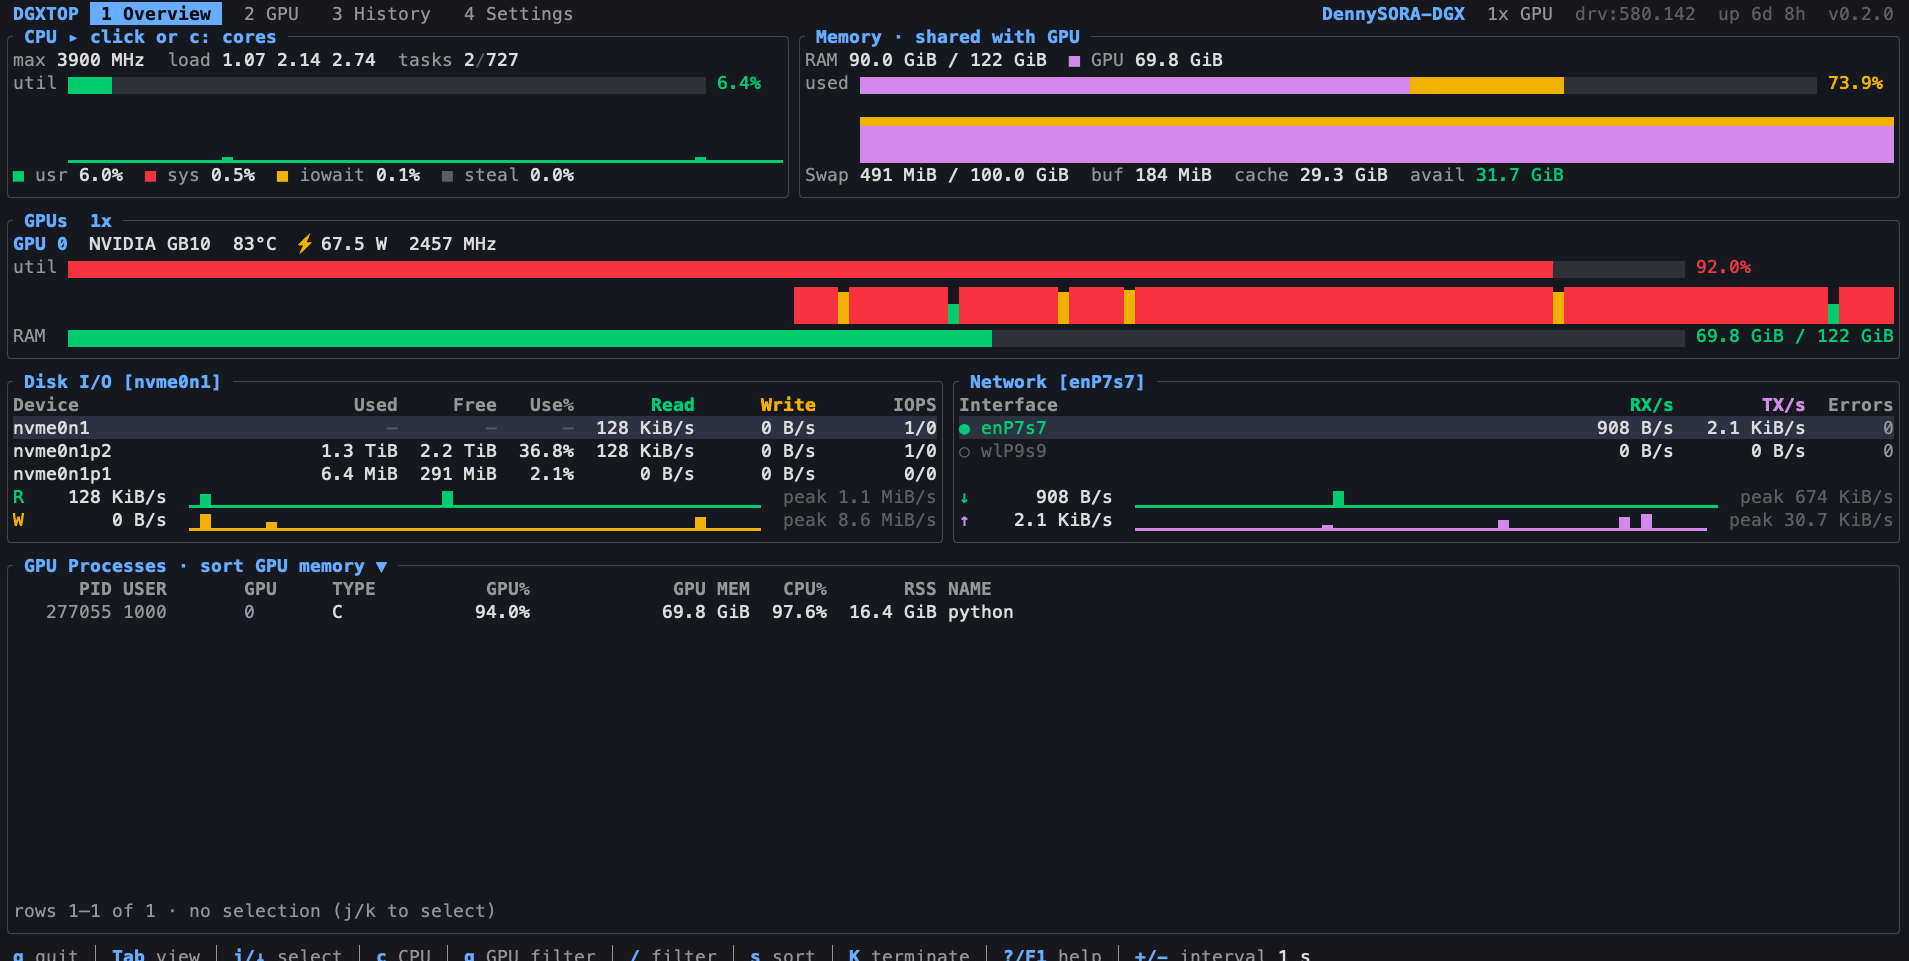
dgxtop is a terminal monitor for NVIDIA GPUs on Linux and DGX Spark. One screen shows every GPU’s utilization, memory, temperature, power and clocks, which job holds how much of its memory, each in its own color, and the rest of the machine: CPU, memory, disks and network. Every GPU job is recorded from start to end with its command line, peak memory and how it ended, and the history stays on disk across restarts. It is built for the DGX Spark and runs on any Linux machine with NVIDIA GPUs.
dgx-spark-overview.webp1909×969
Install
bash
curl -fsSL https://github.com/DennySORA/dgxtop/raw/main/install.sh | bashLinux on x86_64 or aarch64 with glibc 2.34 or newer (Ubuntu 22.04, Debian 12, RHEL 9 and later), DGX Spark included. WSL 2 runs the Linux build. GPU metrics need the NVIDIA driver; without it, CPU, memory, disks and network still work. WSL 1, musl, macOS and Windows are not supported.
The installer picks the build for your CPU, checks it against the release’s SHA256SUMS and installs it to ~/.local/bin. The previous version is kept, and ./install.sh --rollback brings it back.
Source code, full usage and every release: github.com/DennySORA/dgxtop(external site)
Features
htop centers on the CPU, and nvtop and nvidia-smi show GPUs only while you watch. dgxtop puts the GPUs first, shows which job holds how much of their memory, and keeps a record of every GPU job and of the whole machine.
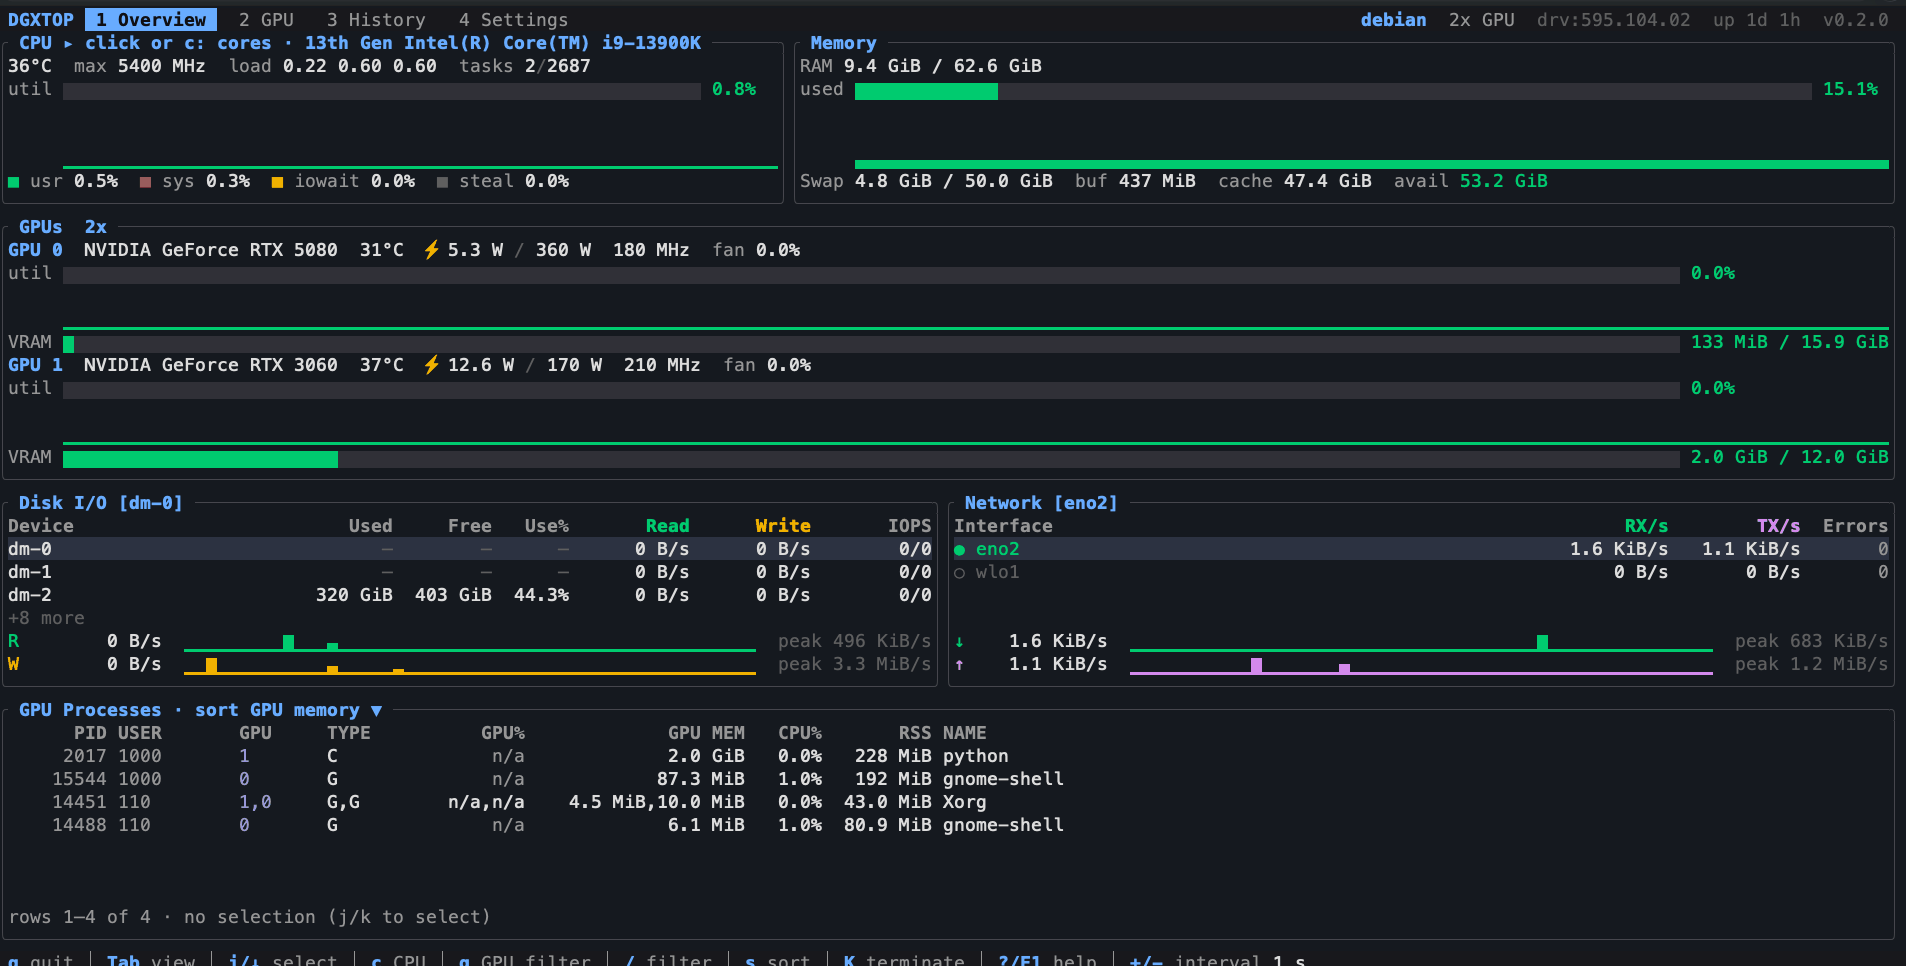
- Every GPU at a glance. Utilization, memory, temperature, power, clocks and fans for each GPU, with live charts. A gauge stays green below 50 % and turns from amber to red as it nears the redline (80 % by default).
- Memory by process. The eight processes holding the most GPU memory each get a color, the same in the memory bars, the charts and the process table, so you see which job holds how much. The color comes from the process name, so a job keeps it when the job or dgxtop restarts, unless another listed process already has it.
- Named by what they run.
python -m vllm.entrypoints.openai.api_servershows asvllm.api_server, andpython main.pyin aComfyUIfolder asComfyUI/main, not aspython3. - GPU processes. Every process using a GPU, with its GPU, type (compute or graphics), GPU use, GPU memory, CPU and RAM. Sort by any column, filter by GPU or name, and stop a process with
K(SIGTERM) orF9(SIGKILL) after a confirmation. - Process History. Every GPU process is recorded as a run, from start to end: its runtime, peak GPU memory and RAM, GPU and CPU use, and how it ended: exited with a code, killed by a signal, stopped from dgxtop, most likely the OOM killer, or still running. Open a run for its full command line, working folder and charts of its CPU, memory, GPU, threads, open files, disk and network.
- Overview History. CPU, memory, each GPU’s utilization, memory, temperature and power, disks and network as bars of 1 minute to 24 hours on the local clock, with now, average and maximum on every chart, and each GPU’s averages, peaks and energy.
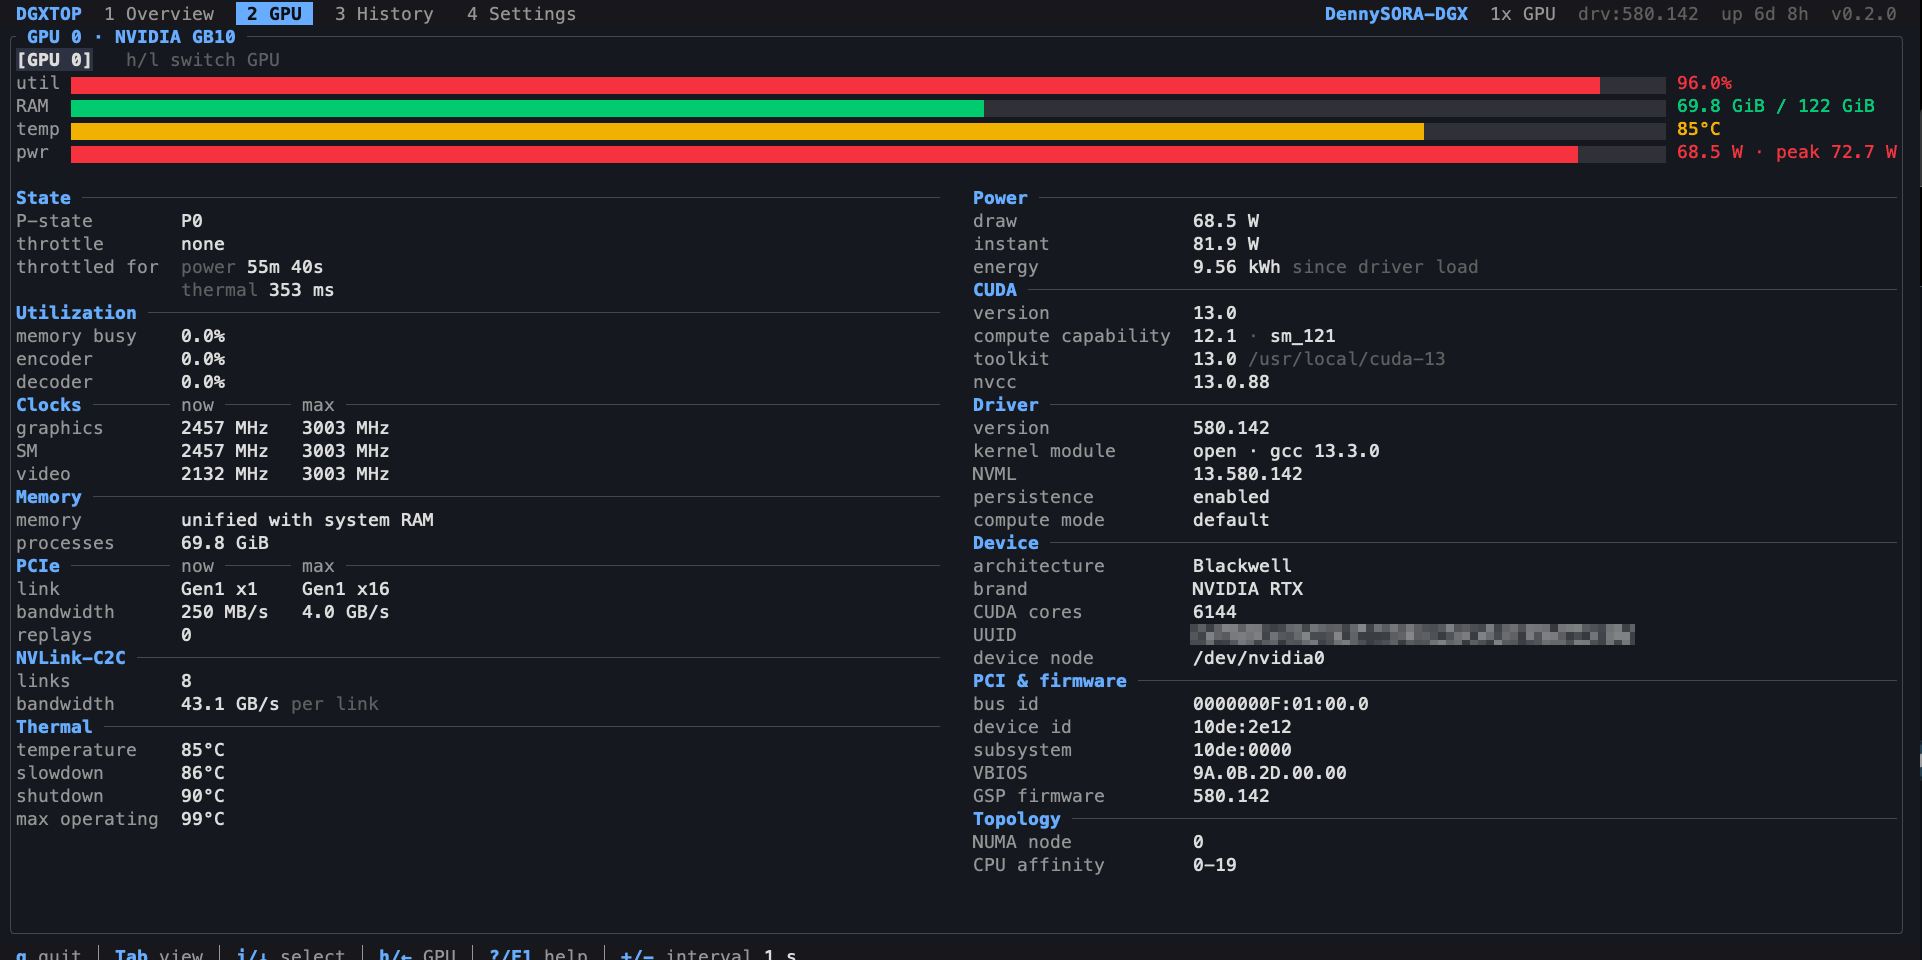
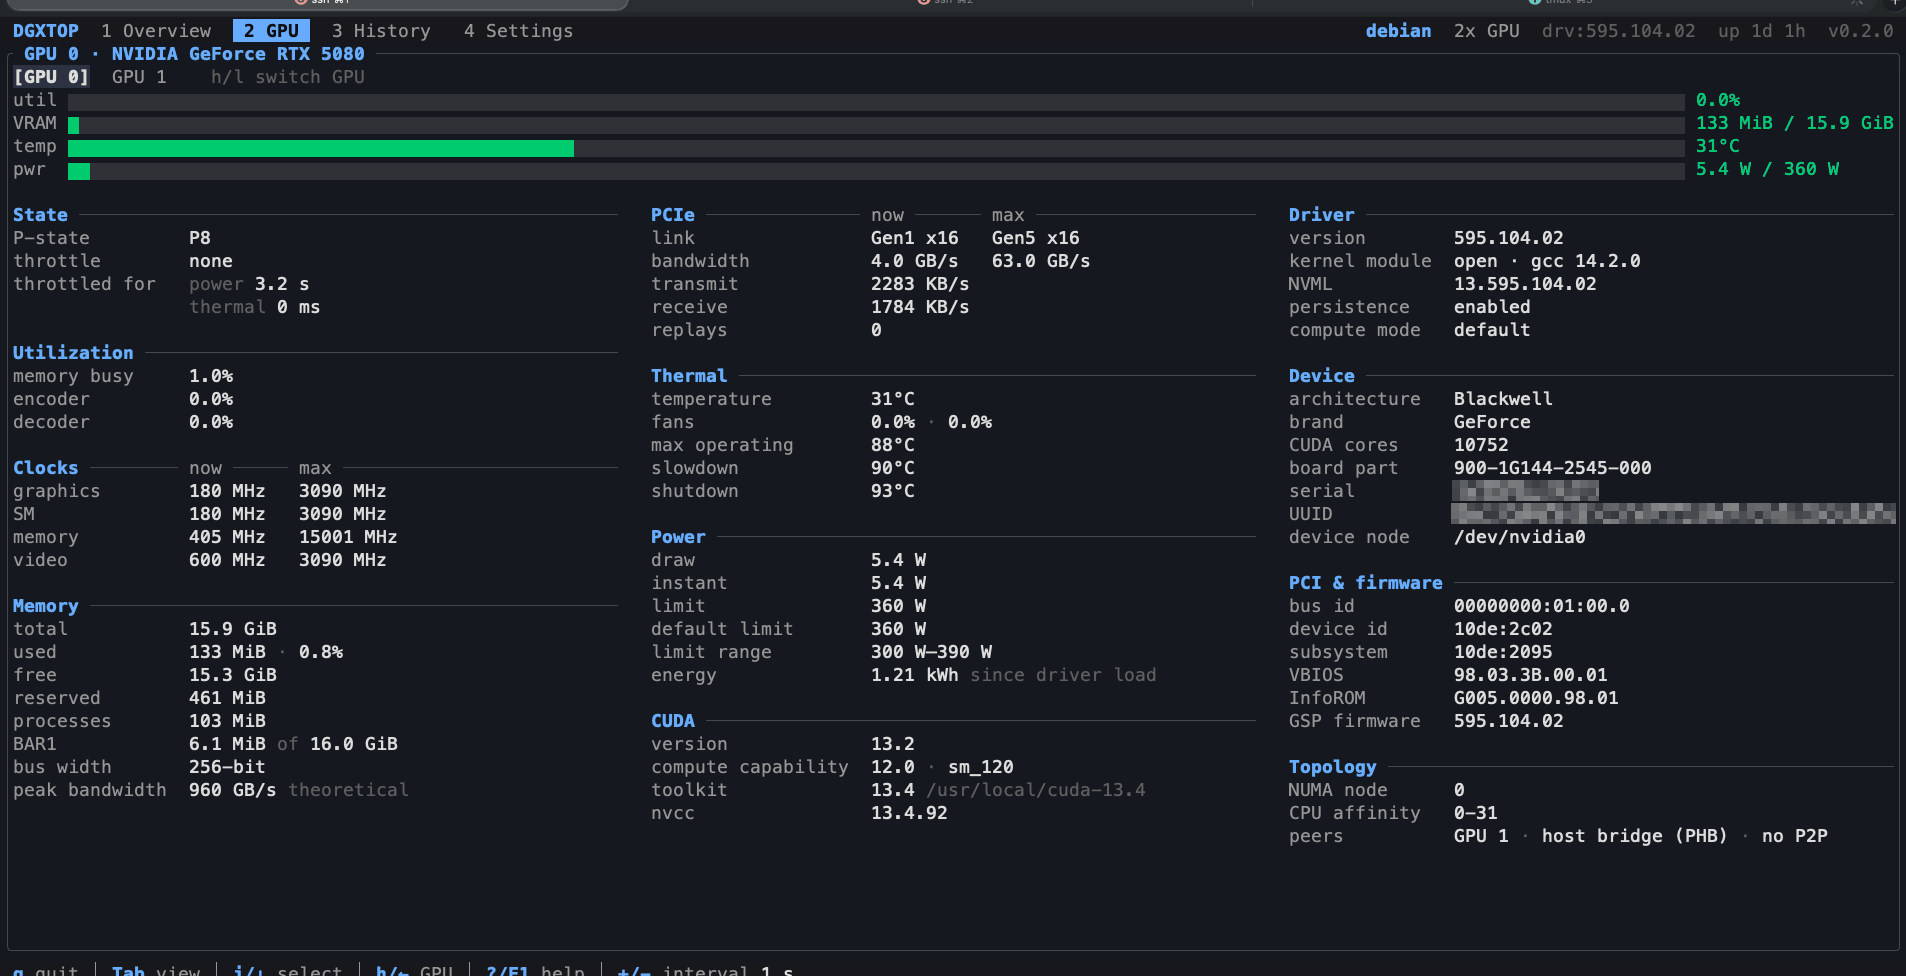
- Full GPU details. One GPU at a time, with everything the driver reports; a value the GPU does not report gets no row:
- performance state, throttle reasons and how long it was throttled, clocks
- memory and the memory bus, PCIe link and traffic, NVLink-C2C
- thermal limits, fans, power limits and energy
- CUDA, driver, NVML and Linux kernel versions
- device, PCI and firmware, NUMA and CPU affinity, P2P paths
- The whole machine. CPU usage per core, CPU temperature and the current and maximum frequency of each kind of core; memory, swap, buffers and cache; disks with free space, IOPS, latency and drive temperature; network throughput, errors and drops.
- Made for DGX Spark. On the GB10’s unified memory, the RAM bar splits into the system’s share and each GPU job’s share. dgxtop also reads the GB10’s CPU cluster temperatures and its NVLink-C2C links, and ships a native aarch64 build.
- Settings in the app. Change the sampling interval and the display modules, and see each data source’s state. Every setting shows its saved and effective value, where it came from, and whether it applies now or after a restart.
Screens
The Overview, the GPU view, Overview History, and Process History with an opened run, on the two machines dgxtop was tested on.
workstation-overview.webp1918×967
dgx-spark-gpu.webp1913×962
workstation-gpu.webp1914×963
workstation-overview-history.webp1913×957

workstation-process-history.webp1910×952

workstation-process-run.webp1919×959

Capabilities
- Several GPUs per machine. Tested on a DGX Spark (GB10) and on a workstation with an RTX 5080 and an RTX 3060.
- History that lasts. History is saved on disk and survives restarts and reboots, with no age limit: each bar size keeps its latest 300 bars, so 1-minute bars cover the last 5 hours and 24-hour bars about 10 months. Process History lists the latest 512 runs. dgxtop records while it runs.
- Light. Written in Rust. It draws new data 4 times a second by default and keeps its data within a fixed 256 MiB.
- Any terminal size. Wide, single-column and compact layouts, down to 40×10. Keyboard and mouse, and four color themes.
- Private. No network access and no telemetry. Settings and history are files only you can read. Process History keeps the command lines, working folders and programs of GPU processes; environments are never stored.
- Safe process actions. Only your own processes, never from a root session, and only after a confirmation that expires. Signals go through a pidfd, so a reused PID is never hit, and every action is logged.
--read-onlyturns them off. - Safe upgrades. The installer verifies every download and keeps the previous version for a one-command rollback.
Architecture
dgxtop is one program. Adapters read the hardware in their own background processes, the readings flow down the data path, and the Manager turns them into the views the screen draws. Each snapshot also feeds the history, and your keys and commands travel the control path.
architecture-en.webpGPT-generated · 1536 × 1024

data path
Linux + NVIDIA driver/proc · sysfs · NVML
Adaptersone background process each
- procfs
- hwmon
- thermal
- powercap
- NVML
- network
- filesystem
Collectorsunits · sources · rates
Statelive snapshot · short trends
Managerreads State and History · views
Viewerscreens · Ratatui
history path
Stateeach committed snapshot
HistoryOverview History · Process History
Compressionbars of 1 min to 24 h
StoreSQLite · files
control path
Viewerkeys · mouse · command line
Managerchecks each command
Settings · sampling · process actionspidfd · confirmed · logged
Viewershows the result
| Component | What it does |
|---|---|
| Adapters | Read the hardware: /proc, hwmon, thermal zones, powercap, NVML for the GPUs, network and filesystems, each in its own background process. A read-only probe follows each GPU process. |
| Collectors | Turn raw readings into metrics: units, the best source for each value, rates from counters, one record per process. |
| State | Holds the live snapshot and the short trends, in memory only. |
| History | Keeps the Overview History and the Process History, and decides what is kept and what goes. |
| Compression | Merges samples into bars from 1 minute to 24 hours, aligned to the local clock. |
| Store | Reads and writes the SQLite databases and files, only as it is asked. |
| Manager | Schedules sampling, applies settings, checks commands and process actions, and builds the views. It keeps no data itself. |
| Viewer | Draws the screens with Ratatui from the Manager’s views, and turns keys and mouse clicks into commands. |
| Runtime | Supervises the adapter processes, their IPC and bounded queues, the log and the terminal. |
The sections below follow one sample through this design and then take each part in turn, as implemented in v2.1.
One sample, end to end
Every second, readings take the same eight steps from the kernel to your terminal, and no step waits for the screen or for a slow adapter.
one-sample-en.webpGPT-generated · 1536 × 1024

- Scheduling. The Manager keeps each group of reads on its own clock: the main group every second, capacity and slow health readings every 5 seconds, device discovery every 10 seconds, and a recheck of unsupported sources every minute. A missed slot is never replayed, and a group still running when its next slot comes is counted as skipped instead of queuing behind itself.
- Requests. Each read plan carries a deadline 500 ms ahead and the adapter’s generation. The supervisor writes it to that adapter’s pipe, and adapters answer in pages, so no request names more than 256 sources.
- Readings. An adapter returns a value or a status: unsupported, permission denied, timeout, error or removed. A failed read never becomes 0.
- Collection. Two collector workers normalize units, turn counters into rates, choose one source for each metric and fold each process into one record.
- One writer. The state actor is the only writer. It checks a commit in full (epoch, base revision, values, units and memory) before changing anything, passes it to the history, and only then publishes one new immutable snapshot. Readers never hold a mutable handle, and a value on the screen is already in the history.
- Drawing. The Manager builds the views from the latest snapshot and the history. The viewer draws new data 4 times a second by default (configurable from 1 to 20), 2 times while dgxtop is under pressure, and redraws at once after a key or a resize, at most 20 times a second.
- Late replies. A reply that comes after its deadline or from an older adapter generation is dropped, and a value older than three sampling periods is marked stale.
Adapter processes
A call into a driver can block, and a blocked call freezes the thread that made it. So dgxtop makes those calls neither on the screen’s thread nor in its own process.
isolation-en.webpGPT-generated · 1536 × 1024

- Seven children. procfs, hwmon, thermal, powercap, nvml, network and filesystem each run in a child process: the same binary, started as
dgxtop --adapter-host <name>, at most 8 of them. - Framed pipes. Each child talks to the supervisor over its own pipes, in frames of a 4-byte length and JSON: at most 1 MiB on the wire and 4 MiB decoded, nested at most 32 deep, 256 records per batch. A handshake nonce and a generation number make sure a reply from an older child is never taken for a new one.
- Back-off. After 3 failures in a row the supervisor waits 1, 2, 4 and up to 60 seconds, with ±10 % jitter, before it starts the child again.
- Clean stops. A child is stopped in steps: a shutdown request with 200 ms of grace, SIGTERM and another 200 ms, then SIGKILL and up to 1 second to reap it. A child that cannot be reaped is quarantined and never started again, so stuck processes never pile up.
- Threads, not async. The main process runs no async runtime. The terminal runs on the main thread beside named threads for the manager, the supervisor, the log and signals, two collector workers, and small actors for state, history, the audit log, process actions and the process probe. They talk over bounded crossbeam channels; no queue anywhere is unbounded.
- In view. Settings lists each adapter process with its state, its last success and its back-off.
Choosing a source
One quantity often has several sources: a CPU temperature can come from hwmon and from a thermal zone. dgxtop shows one value per metric and never averages sources.
source-arbitration-en.webpGPT-generated · 1536 × 1024

- One key. A metric key names the host, the boot, the entity, the metric and its scope. Only readings with the same key compete, so a SoC temperature never competes with the CPU package.
- Four labels on every value. Each value carries its read status, its kind (measured, derived or estimated), a quality grade (verified, usable, suspect, unknown or invalid) and its freshness. Only verified and usable values can stand for the metric.
- A fixed order. Units are normalized and checked. A sensor confirmed to be the same one seen through two interfaces counts once; equal values alone never prove it. The rest are ranked by quality grade, then the source’s priority, then the newest read, then the source ID. At most 4 candidates are compared, and the result never depends on the order in which readings arrive.
- Conflicts, not averages. When two different sensors disagree by more than a tolerance (8 °C for temperatures), dgxtop marks a conflict instead of averaging them.
- No flapping. A better source takes over only after it wins 3 rounds in a row over at least 5 seconds.
- Repeatable. The arbitration does no I/O, holds no state and records why each value won, so the same readings always give the same answer.
History in tiers
Overview History keeps months of data in a fixed space: every series is stored at twelve bar sizes, and each size keeps its latest 300 bars.
history-tiers-en.webpGPT-generated · 1536 × 1024

- Buckets. Each sample lands in a 5-second bucket, and the latest 120 buckets cover the last 10 minutes. A bucket stores its start, the time it covers, the sum of value × time, the minimum, the maximum and the number of samples it merged.
- Twelve bar sizes. Buckets merge into bars of 1, 5, 10 and 30 minutes and of 1, 2, 4, 6, 8, 12, 18 and 24 hours. At 300 bars each, 1-minute bars reach back 5 hours and 24-hour bars about 300 days.
- Time-weighted means. A bar’s mean is its sum of value × time divided by the time it covers, so a bar with a gap is not diluted, and time without data stays a gap instead of becoming 0.
- The local clock. Bars follow the local clock: hours start on the hour where you are, and a 24-hour bar runs from local midnight to midnight.
- On disk. The bars live in history_tiers.sqlite3 within about 40 MiB, and minute rows also go to history.sqlite3 for 7 days, up to 1 GiB. Both survive restarts; dgxtop records while it runs.
How Process History works
Process History follows each GPU process from the first time NVML lists it until it ends, without root and without scanning /proc.
process-history-en.webpGPT-generated · 1536 × 1024

- Identity. A run is a PID together with the process’s start time and the boot it runs in, so a reused PID never continues another process’s run.
- A read-only probe. For up to 64 processes at a time it reads
/proc/<pid>/stat,ioandstatus, counts open files every 10 seconds, and reads the command line, working folder, program and cgroup once, at most 4096 bytes each. - What a run records. CPU, resident memory, GPU use, GPU memory, disk reads and writes and the host’s network, in 5-second buckets and the same twelve bar sizes as Overview History.
- How it ended. dgxtop works out the end from what an ordinary user can see: its own signal, if it sent one in the last 60 seconds; the OOM killer, when the kernel’s oom_kill count rose and the process died by SIGKILL or left no status; otherwise the exit code or signal read while it was a zombie. A run still open when dgxtop stopped is marked as ended while dgxtop was off.
- What is kept. Recent buckets are saved to process_recent.json every 30 seconds and runs to process_history.sqlite3 within about 40 MiB. The list shows the latest 512 runs, and the oldest ended runs go first.
GPU memory by process
dgxtop gives each of the processes holding the most GPU memory a color and keeps it stable, so one job can be followed across the memory bars, the charts and the process table.
gpu-memory-en.webpGPT-generated · 1536 × 1024

- Names that say what runs. A process is named by what it runs: the module of
python -m(vllm.entrypoints.openai.api_server→vllm.api_server), the script (train_supervisor.py→train_supervisor), the full program name when the kernel’s 15-bytecommcut it short, and the folder for generic names (main.pyinComfyUI→ComfyUI/main). Only that name is kept, cleaned of control characters. - Stable colors. The color is an FNV-1a hash of the name over eight colors, so a job keeps its color when it or dgxtop restarts. When that color is taken, the next free one is used.
- No flicker. With all eight colors in use, a newcomer takes the place of the smallest only if it holds twice as much memory plus 256 MiB. dgxtop tracks 16 processes, twice the colors, so a job that just exited keeps its color for a while.
- Unified memory. On a DGX Spark the GPU shares the system’s memory, so the RAM bar splits into the system’s share and each GPU process’s share, in its color.
Safe process actions
Stopping a GPU job from dgxtop takes two steps and sends exactly one signal, and every attempt is on record.
safe-actions-en.webpGPT-generated · 1536 × 1024

- Whose processes. Only your own, never PID 1 or dgxtop itself, and never from a root session. SIGKILL is allowed by default and can be turned off;
--read-onlyturns every action off. - Two steps.
K(SIGTERM) orF9(SIGKILL) asks first. The confirmation names that one process, expires after 10 seconds, and at most 8 can wait at once. - A pidfd, not a PID. dgxtop opens a pidfd, checks the start time, user and namespace again, and signals through
pidfd_send_signal, so a PID reused in the meantime is never hit. - Intent first. The intent is written to audit.sqlite3 (WAL, synchronous=FULL) before the signal goes out, and the outcome after it; if the intent cannot be written within 1 second, nothing is sent. If dgxtop stops between the two, the outcome stays unknown and the signal is never sent again.
- After the signal. dgxtop watches the process for 10 seconds, every 250 ms, and the run in Process History records that it was stopped from dgxtop.
Limits and overload
dgxtop is meant to run for months beside the jobs it watches, so nothing in it grows without bound.
budgets-en.webpGPT-generated · 1536 × 1024

- One memory budget. Its data lives in a fixed 256 MiB, split in advance: raw history 144 MiB, aggregates 32, catalog 24, reserve 20, live state 16, views 12 and incoming readings 8. Memory is reserved before it is used.
- Every queue has a cap. A full command queue (128) answers busy instead of growing, and readings in flight stop at 32 batches and 8 MiB. dgxtop tracks at most 512 series, 2048 sources with 4 candidates per metric, 256 processes and 1024 GPU process links, and allows 2 view sessions.
- Pressured. When a queue stays 75 % full, or a round of work takes longer than the sampling period, for at least 3 seconds, dgxtop is pressured and draws at most 2 frames a second.
- Throttled. When memory reaches 90 % of the budget or incoming readings stay full, dgxtop is throttled: it samples the main group 2 times, then 4 times, less often.
- Recovering, in the open. Once queues are under 50 % and memory under 75 %, dgxtop steps back one level at a time, at most every 30 seconds. The footer shows the effective interval whenever it differs from the one you set.
Files on disk
dgxtop writes only under your XDG config and state directories, with permissions that let only you read them.
storage-en.webpGPT-generated · 1536 × 1024

- Private by default. Directories are created 0700 and files 0600, and a path that runs through a symlink is refused. One dgxtop runs per state directory, guarded by instance.lock.
- Atomic settings. config.json is written to a new temporary file (0600, created exclusively), synced, renamed over the old file, and the directory is synced, so a crash never leaves half a file.
- Formats, not migrations. Each database records its format in the SQLite application_id. A database in another format, such as one from v2.0, is recreated empty instead of migrated.
- Durable where it matters. audit.sqlite3 syncs every write (synchronous=FULL). The history databases use WAL with synchronous=NORMAL: a power cut can lose the last moments of history, but they sync far less often.
- Private data. No network access and no telemetry. Process History keeps the command lines, working folders and programs of GPU processes; environment variables are never read.
| File | Holds | Limit |
|---|---|---|
| config.json | settings | — |
| history_tiers.sqlite3 | Overview History bars, 1 minute to 24 hours | about 40 MiB |
| history.sqlite3 | minute rows | 7 days and 1 GiB by default |
| process_history.sqlite3 | Process History runs and their bars | about 40 MiB |
| process_recent.json | recent 5-second buckets of GPU processes, saved every 30 s | recent buckets only |
| audit.sqlite3 | process actions, the intent before the outcome | 30 days, 128 MiB |
| dgxtop.log | the log | rotates at 10 MiB, 3 files |
| instance.lock | one dgxtop per state directory | — |
Code structure
The code is a Rust workspace of eleven crates around one shared contract crate.
crates-en.webpGPT-generated · 1536 × 1024

- One dependency rule. Every crate depends only on dgxtop-core, which holds the shared types, views and ports and does no I/O. The one exception is history using the pure compression crate, and only the dgxtop crate wires the others together.
- Checked in CI.
scripts/check_boundaries.pychecks the rule in CI, next tocargo fmt,clippywith warnings as errors, and the tests on x86_64 and aarch64. - Released by CI. A release is built on Ubuntu 22.04 for x86_64 and aarch64 and published with SHA256SUMS. The installer then installs it on Ubuntu 22.04 and 24.04 on both architectures, Debian 12 and Rocky 9, and must refuse Alpine’s musl.
| Crate | Contains |
|---|---|
| dgxtop | The program: command line, modes, startup and wiring |
| dgxtop-core | Shared types: metrics, commands, views and the interfaces between components |
| dgxtop-runtime | Background processes, IPC, queues, the log, the terminal and the time zone |
| dgxtop-adapters | procfs, hwmon, thermal, powercap, NVML, network, filesystems, the process probe and process actions |
| dgxtop-collectors | Metrics from readings: rates, source selection and process records |
| dgxtop-state | The live snapshot and the short trends |
| dgxtop-history | Overview History, Process History and what each keeps |
| dgxtop-compression | Bars from 1 minute to 24 hours |
| dgxtop-store | SQLite databases and files |
| dgxtop-manager | Scheduling, settings, sessions, process actions and views |
| dgxtop-ui | Screens, widgets and the key map |
来源:Hacker News · dennysora.me